Most Used Chart Patterns in Stock Market Detailed Explanation
To become a successful trader in stock market one must know these important chart patterns to identify trading opportunities in price trends


Symmetrical Triangle :

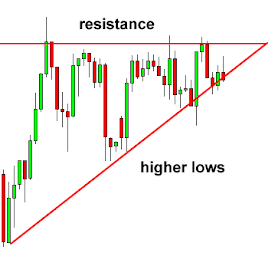
Ascending Triangle :

Double Top :


Rounding Bottom :

Head and Shoulders:
H&S pattern mostly indicates a bullish trend turning into a bearish one. The pattern appears as a baseline with three peaks, where the outside two are close in height and middle is the highest. first and third peaks are shoulders and the second peak forms the head
- Left Shoulder
- Head
- Right Shoulder

Line drawn along the intermediate lows is Neckline. The pattern is considered completed only when the price having formed the right shoulder falls below the neckline.
Cup and Handle :
The cup & handle is considered a bullish pattern. this pattern resembles a cup with a handle where the cup is in the shape of a U and the handle has a slight downward drift.

Cups with wider U shapes are more reliable then V shapes, this formation can take anywhere from 2 months to over 1 year to form
Wedge :
A wedge is a price pattern marked by converging trend lines on a price chart. two trend lines are drawn to connect the respective highs and lows of a price. a wedge pattern can signal either bearish or bullish reversal. there are two types of wedge patterns one is Rising Wedge and the other one is Falling Wedge

Price needs to break trend lines drawn above or below to confirm its a bullish or bearish trend. mostly wedge patterns have a tendency to break in opposite directions therefore Rising wedge pattern is considered as bearish and Falling wedge as bullish. in either way its better to wait until trend line is crossed to confirm the trend.
Pennant :
Pennant is a type of continuation pattern it's formed when there is a large movement in a stock known as flagpole. then the flagpole is followed by a consolidation period with converging trend lines.
Bull Pennant

Bearish Pennant

Pennants tend to start with large trading volumes (flag Pole) and are followed by decreasing volume during consolidation (Flag Formation).whether its a bullish or bearish pennant its better to enter a trade once breakout or breakdown is confirmed.
This is similar to a Pennant, but there is no flag pole formation.it occurs when a stock price is consolidating in a way that generates two converging trend lines with similar slopes.

If the price rises above the trend line its a bullish trend if it falls below the trend line then its a bearish one.
An Ascending Triangle is a chart pattern created by price moves that allows for a horizontal line to be drawn along the swing highs and a rising trendline to be drawn along the swing lows. these two lines form a triangle.

If the price rises above the horizontal line then its bullish if it falls below the trendline then its bearish.
Descending Triangle :
This chart pattern is created by drawing one trendline connecting a series of lower highs and a horizontal line connecting a series of lows. these two lines form a triangle.

This pattern commonly considered as a bearish pattern or a continuation pattern with an established downtrend. however a descending triangle pattern can also be considered bullish if price breaks out of a trendline. its better to enter a trade only after breakout or breakdown is confirmed.
A double top is an extremely bearish technical reversal pattern that forms after an stock reaches a high price two consecutive times with a moderate decline between two highs.

If price falls below the neckline then it might be interpreted as a sell signal.
Double Bottom :
The Double Bottom looks like letter 'W'. the twice touched low is now considered a significant support level. while those two lows hold the upside has new potential.

This Pattern usually forms after a significant downtrend and it might be a sign that selling pressure is about finished and that a reversal is about to occur.
This chart pattern is identified by a series of price movements that graphically forms the shape of a 'U'. Rounding Bottoms are found at the end of extended downward trends and signify a reversal in long term price movements. this pattern looks like cup & handle but without the handle.
- The decline
- The bottom
- The incline


This bullish trend can take anywhere from a few weeks to a couple of months to form.
Horizontal Channel :
A horizontal channel has the appearance of a Rectangle Pattern. this patterns form in periods of price consolidation. Price is framed out in a trading range by the pivot highs (resistance) and pivot lows (support). trend lines are drawn on pivots to give a visual picture of price action.

If price breaks above the Resistance then its technically a buy signal and if price falls below Support line its technically a sell signal.
These are the few important chart patterns used by traders for technically analyzing a stock. we can manually identify these patterns in various charts by regular practice. one must most importantly note that following any kind of chart patterns wont guarantee 100% success rate, so its important to have a stop loss when you are buying a stock using chart patterns.
Comments
Post a Comment